A small-district school board race can cost a few hundred dollars or less, a competitive city council seat commonly runs into the thousands to tens of thousands, and a big-city mayoral race can reach several million dollars. The office title doesn’t set that range. Voter population, media market, competitiveness, and local finance rules do.
That spread is the central problem for anyone asking how much does it cost to run for local office. A single average hides more than it reveals. A candidate who budgets from a statewide average may overfund a quiet, uncontested race or, more dangerously, underfund a competitive district where mail, staff, and repeated voter contact drive the total.
A disclosure-led approach works better. Start with reported spending for comparable races, separate fixed costs from scalable costs, then price the number of likely voters a campaign needs to reach. The result isn’t a universal price. It’s a defensible range tied to a specific electorate.
Budget Ranges by Office and Market Size
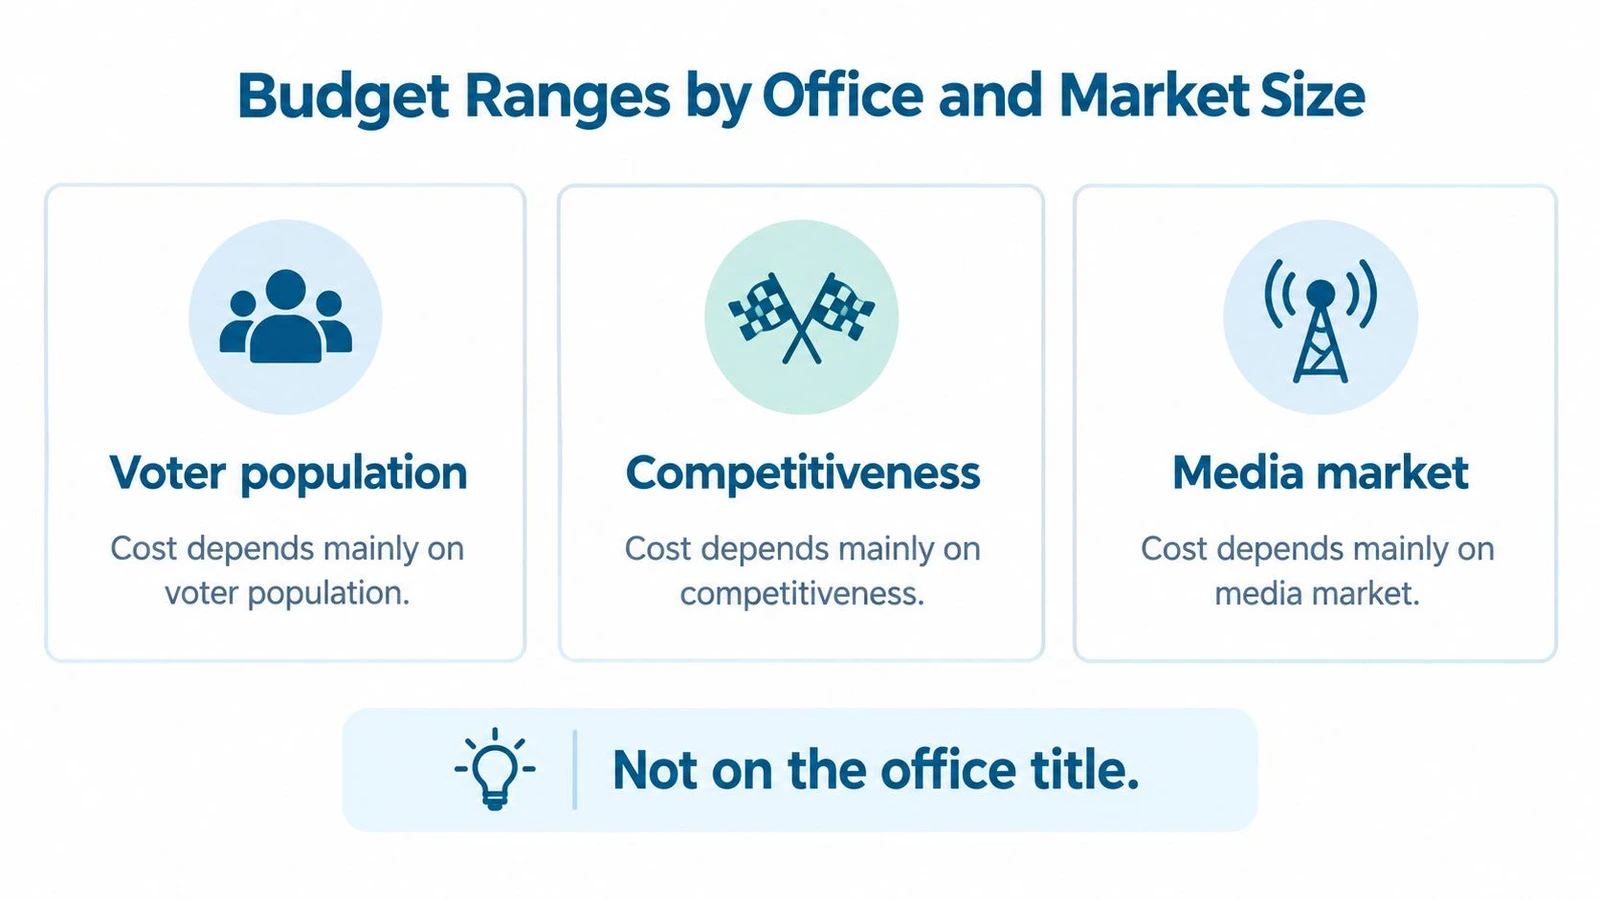
Cost depends mainly on voter population, competitiveness, and media market, not on the office title. A school board seat in a large, contested district can require more voter contact than a council seat in a small city. A mayoral race in a major media market operates in a different budget category entirely.
The table moves from the smallest reported races to the largest. These figures come from published averages and surveys, including Los Angeles spending reported in the Government Accountability Office public financing review, which recorded participating city council candidates at $633,412 on average and nonparticipating candidates at $28,464.
Typical Campaign Totals by Office and Market Size
| Race type | Typical total spend | Basis |
|---|---|---|
| School board, small district | Under $100 for most candidates | Brookings survey, 67% spent under $100 |
| School board, larger district | Over $5,000 for most candidates | Brookings survey, 55% spent over $5,000 |
| City council, 17 largest Massachusetts cities | $15,537 average | 2025 reports, 354 candidates |
| City council, Los Angeles, nonparticipating | $28,464 average | 2022 public-financing report |
| City council, Los Angeles, participating | $633,412 average | 2022 public-financing report |
| Mayor, Los Angeles, participating | $4,881,304 average | 2022 public-financing report |
| Mayor, Los Angeles, nonparticipating | $13,833,432 average | 2022 public-financing report |
Each row measures something different. The school board rows describe what most surveyed candidates spent, not a recommended budget. The Massachusetts and Los Angeles rows are averages, so they’re midpoints across stronger and weaker campaigns, not floors or ceilings. A serious challenger in a contested district should expect to plan above a field-wide average that includes nominal candidates.
Los Angeles shows why public financing can’t be treated as a footnote. Participating city council candidates received an average of $198,151 in public funds, and participating mayoral candidates received $1,284,158, based on the same reported program data. Participating mayoral candidates also spent far less on average than nonparticipating mayoral candidates, while participating council candidates spent far more than nonparticipants. Public financing changed both available resources and spending behavior, but not in one simple direction.
Planning benchmark: A low-visibility local race can operate on tens of thousands of dollars, while a major-city contest may require hundreds of thousands or several million dollars.
Those two benchmarks frame the plausible range. The candidate’s task is locating a specific district inside it, using electorate size and expected competition rather than copying the budget for the same office title in another market.
Where Local Campaign Money Actually Goes
Communications take the largest share of most local budgets. The New Jersey Election Law Enforcement Commission school election analysis found communications accounted for nearly $1.6 million, or 70% of total candidate outlays, while all other expenses represented $715,161, or 30%. In that analysis, total spending reached $9.6 million, and average annual spending rose from approximately $427,123 in the 1990s to nearly $1 million during 2000 to 2009.
That structure matters more than any single vendor quote. Mail, advertising, digital outreach, printed materials, and voter contact usually absorb the largest share because they scale with the universe. Staffing, compliance, events, transportation, data, and administration make up most of the remainder.
Campaign Expense Categories and How They Behave
| Expense | What it buys | Fixed or scalable | Planning note |
|---|---|---|---|
| Filing and legal fees | Candidate filing, legal review | Fixed | Varies, some jurisdictions charge no filing fee |
| Compliance and bookkeeping | Treasurer, finance software, reports | Fixed | Rises with fundraising volume |
| Staff | Campaign manager, field lead, paid canvassers | Scalable | Often the second-largest line after communications |
| Direct mail | Printing, postage, list rental | Scalable | Usually the largest communications cost |
| Digital ads | Social and search ads, geographic targeting | Scalable | Set daily caps to control spend |
| Yard signs | Signs, stakes, installation | Scalable | Low unit cost, storage and replacement add up |
| Events | Venue, food, printed materials | Mostly fixed per event | Cheap if hosted in volunteer homes or community space |
| Canvassing | Turf, walk lists, transport, volunteer supplies | Scalable | Volunteer time has a labor-equivalent cost |
| Voter data | Voter records, filtered lists | Scalable by record count | Pay only for the filtered universe needed |
| Field software | Canvassing app, logins, campaigns, support | Fixed by plan tier | Choose tier by team size |
Filing and compliance come first because everything else depends on them. They’re mostly fixed, although bookkeeping effort rises as contribution volume grows. Rules vary sharply by place. Some jurisdictions charge candidate filing fees, while Texas guidance states that local authorities may not charge a fee for campaign-finance filings.
Communications lines behave differently. Direct mail rises with each household and each additional piece, which is why candidates comparing formats and print specifications can use flyer preparation advice from Power Print before committing to a print run. A campaign weighing mail against other contact methods can also review how political mailers fit into a local contact plan to keep print decisions tied to the target universe rather than district-wide habit.
The fixed versus scalable split tells a candidate where an extra dollar adds contact. Fixed costs keep the campaign legal and organized. Scalable costs determine how many voters hear from it, how often, and through which channel.
Sample Budgets for Three Campaign Scales
The following budgets are illustrative planning estimates, not published averages. They translate the spending patterns in reported races into three usable scenarios. Each scenario assumes the campaign pays required filing and compliance costs first, then scales communications and field activity to the size and competitiveness of the race.
Sample Budgets by Campaign Scale
| Line item | Shoestring school board | Competitive small-city council | Contested large-city council |
|---|---|---|---|
| Filing and compliance | $100 | $800 | $5,000 |
| Printing (signs, literature) | $100 | $1,500 | $8,000 |
| Direct mail | $0 | $4,500 | $25,000 |
| Digital ads | $0 | $2,000 | $20,000 |
| Canvass materials and voter data | $0 | $2,100 | $12,000 |
| Events | $0 | $1,100 | $2,000 |
| Part-time staff | $0 | $2,000 | $23,000 |
| Contingency | $50 | $1,000 | $5,000 |
| Total | $250 | $15,000 | $100,000 |
The $250 shoestring scenario is mostly filing and printing, with a small contingency. It fits a very small or low-visibility race where personal networks and volunteer effort carry voter contact. It doesn’t fund repeated paid contact, so it shouldn’t be mistaken for a competitive field plan.
The $15,000 small-city scenario puts direct mail first, followed by canvass materials and voter data, digital advertising, and part-time staff. That order reflects a campaign large enough to need paid reach but small enough to rely on a lean team. Events and printing support visibility, while the contingency protects against replacement signs, added data, or a late contact push.
The $100,000 large-city scenario grows mainly through direct mail, digital ads, and part-time staff. Those lines rise because the voter universe is larger and repeated contact requires coordination. Canvass materials and voter data also expand, since a bigger field operation needs cleaner lists, more turf, and more supervision.
Adjustments matter as much as totals:
- Uncontested race: Filing, compliance, and basic communication may be enough, with little reason to fund repeated paid contact.
- Volunteer-run campaign: Staff money can move into canvassing supplies and contingency, although volunteer coordination still takes time.
- Incumbent campaign: Name recognition may allow less introductory mail and a stronger emphasis on targeted digital contact.
The closest scenario should be chosen by electorate size and competition first. Line items can then be repriced with local vendor quotes and jurisdiction-specific fees.
Spending Timeline From Filing to Election Day
Timing can break an otherwise sound budget. Fixed costs land early, while the most expensive voter contact lands late. A campaign that spends too freely at launch may enter the final weeks without enough cash for canvassing, mail, or digital persuasion.
Four Spending Phases
- Before filing: The campaign confirms the candidate filing fee, disclosure schedule, and public financing rules, then opens the campaign account and appoints a treasurer. These steps create the legal and financial structure before public spending begins.
- Early phase, roughly six months out: The campaign buys voter data and a field software tier, prints initial literature, and establishes compliance routines. Early data work defines the likely voter universe before expensive contact begins.
- Middle phase, roughly two to four months out: Mail drops begin for likely voters, digital ads launch with daily caps, and canvassing expands through volunteer or paid shifts. Spending should follow the filtered universe, not every registered household.
- Final phase, the last several weeks: Canvassing and digital spending concentrate on remaining targets, with a second mail piece added if reserves allow. The contingency stays available for a late outside-spending response or urgent field need.
After election day, the campaign files its final disclosure report and resolves outstanding obligations under local rules. That closing step belongs in the compliance budget from the start, not as an afterthought.
Most fixed costs arrive early. Most scalable costs arrive late. Cash should therefore be held back for the final phase, when each additional contact is closest to voting.
Fundraising Targets and Public Matching Funds
A candidate doesn’t always have to raise the full budget from private contributors. In New York City’s 2025 cycle, the New York City Campaign Finance Board post-election summary reported $41.1 million from individual contributors, 88.2% of contributions as small-dollar, and $86.8 million in public matching funds distributed to 131 candidates. Those figures show how a matching system can change the private cash a campaign must raise.
The lesson isn’t that every local candidate has access to that support. Financing rules are highly local. A jurisdiction may offer matching funds, impose contribution limits, require specific filings, charge no candidate filing fee, or provide little support at all. The fundraising target therefore starts with the rules, not with an aspirational total copied from another city.
Donor Count Needed to Fund a Campaign Budget
| Campaign budget | At $100 average gift | At $250 average gift | At $500 average gift |
|---|---|---|---|
| $500 | 5 donors | 2 donors | 1 donor |
| $15,000 | 150 donors | 60 donors | 30 donors |
The math exposes a practical constraint. A modest budget funded through small gifts may require a much larger donor network than a first-time candidate expects. Campaigns building that network can adapt grassroots fundraising approaches for campaigns in 2026 to local contribution rules and reporting requirements. A cushion should also be added for returned checks, refunds, processing issues, and pledged donations that never arrive.
Public matching funds can reduce the number of private dollars required, but eligibility and qualifying rules control the benefit. A candidate should model two versions of the budget where a program exists: one with expected matching funds and one without them. That prevents a campaign from committing to staff or mail based on money that may arrive late or not qualify.
Pricing the Volunteer Model
Volunteer labor lowers cash spending, but it isn’t free. A volunteer-led campaign still pays, in cash or time, for recruitment, training, turf preparation, transportation, supervision, data cleaning, and missed work by volunteers. Weak supervision can also produce slower route coverage and poorer data quality, which raises the cost of later contact because the campaign can’t trust its own records.
The break-even comparison should be made door by door. On one side sits the cost of a paid canvasser shift, including supervision and materials. On the other side sit volunteer hours valued as labor, plus recruitment, training, transportation, supplies, and data cleanup. Paid canvassing becomes cheaper per door reached when volunteer coordination consumes so much staff time, or produces so many incomplete routes, that the apparent savings disappear.
The cheapest cash campaign isn’t necessarily the cheapest campaign overall. A campaign can trade money for slower coverage, weaker data, and repeated work.
A sound fundraising target therefore includes both cash expenses and labor-equivalent costs. That fuller accounting tells the candidate whether volunteers, paid canvassers, mail, or digital outreach deliver the next useful contact at the lowest total cost.
Cutting Costs Without Losing Voter Contact
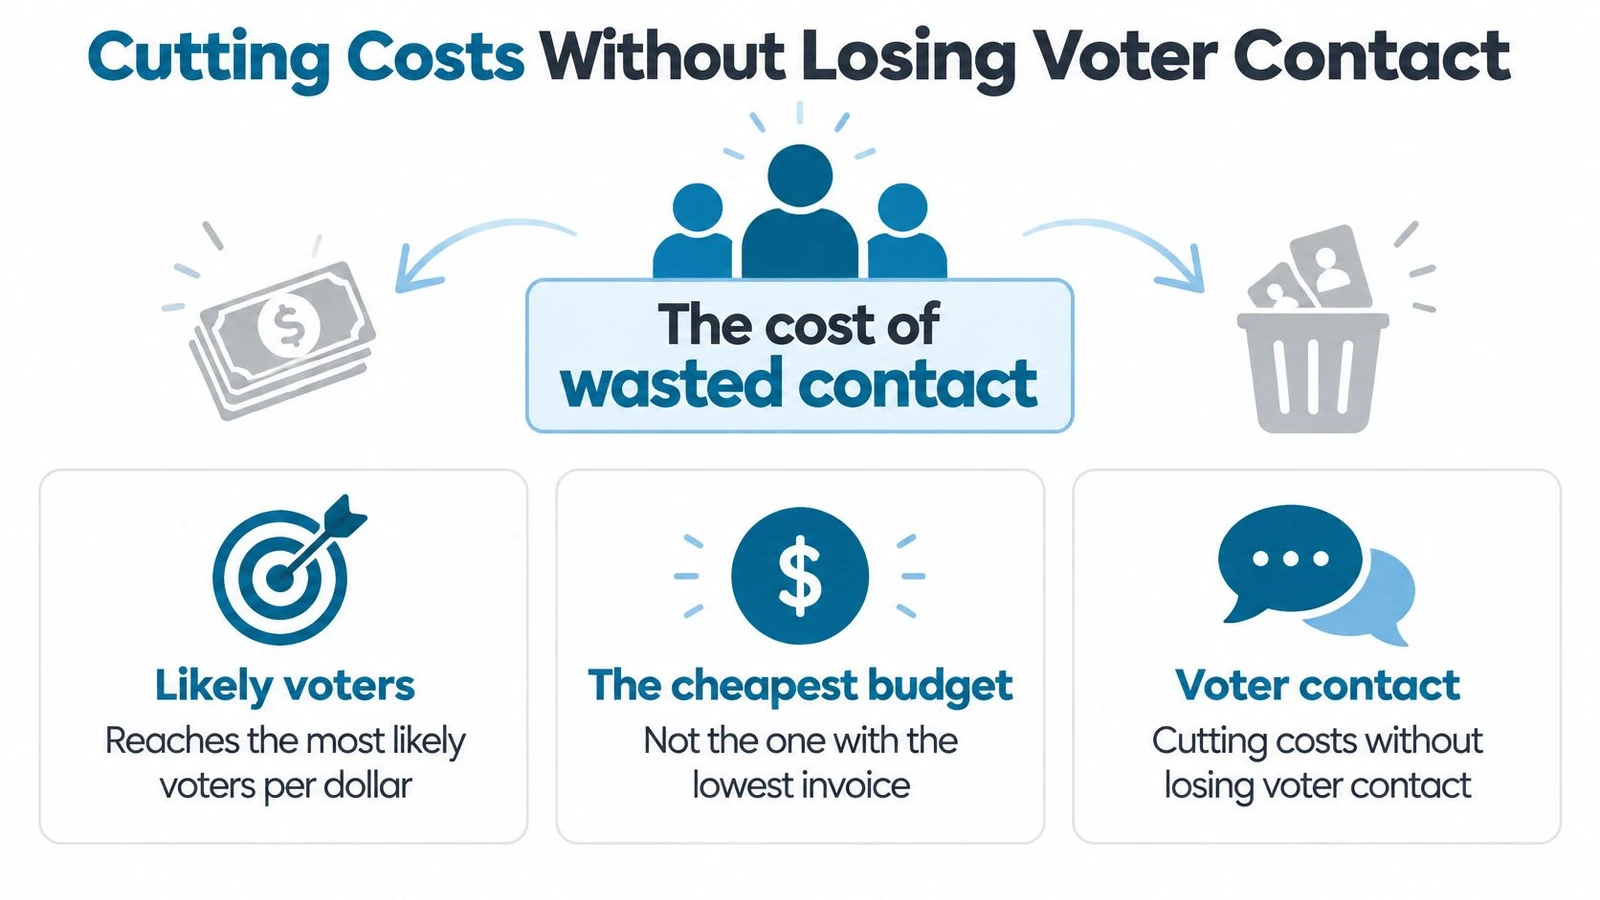
The cheapest budget isn’t the one with the lowest invoice. It’s the one that reaches the most likely voters per dollar. Wasted contact is the hidden expense in local campaigns, whether it appears as mail to households unlikely to vote, canvass routes that don’t fit a shift, or data purchased for voters outside the target universe.
- Build balanced walk routes: Routes sized for one shift let each canvasser cover more doors without manual map work. The trade-off is setup time to define sensible boundaries and check difficult geography.
- Plan for weak connectivity: Field tools that capture data offline and sync automatically when signal returns prevent lost canvass records. The trade-off is training volunteers to confirm sync before ending a shift.
- Remove manual file transfers: Filtering voter records by state, race, party, and vote history, then loading the filtered list directly, reduces export and import errors. doornoc is one option that combines canvassing workflows with voter list handoff, although any system should be judged by data quality and team size.
- Choose software by actual need: The correct field software tier depends on logins, campaigns, and support requirements, not the largest available plan. The trade-off is revisiting the tier if the team grows quickly.
- Use live field visibility: A real-time dashboard lets coordinators move volunteers toward unfinished routes the same day. The trade-off is assigning someone to monitor progress and act on it.
- Restrict paid media to the target universe: Mail to likely voters and geographically targeted digital ads reduce spending on households outside the persuasion or turnout plan. Candidates trying to save time planning social content can apply the same scheduling discipline to campaign posts, while paid placements stay tied to the filtered universe.
Cost cutting should also compare channels on cost per useful contact, not cost per attempt. A campaign evaluating that trade-off can use a cost per vote comparison of canvassing and phone banking as a framework for deciding where the next dollar belongs.
When Outside Spending Changes Your Budget
A candidate’s own spending doesn’t define what voters see. Independent groups can add mail, digital advertising, and other communications that reshape the race without appearing in the candidate’s budget. That gap is where a carefully priced local campaign can suddenly look too small.

New York City illustrates the scale. The Massachusetts city council spending release and related municipal comparisons sit alongside New York City figures showing $123.5 million spent across all municipal races, including $18.6 million by city council candidates. Independent expenditures reached $83.2 million, nearly matching the $86.8 million distributed through public matching funds, while city council independent spending exceeded $15.5 million.
A local candidate with a lean plan may therefore compete inside a much larger communications environment. The response should be prepared before outside spending appears:
- Hold a contingency reserve: Size it to the competitiveness of the race and keep it available for the final phase.
- Decide the message response in advance: The campaign should know whether contrast mail, targeted digital advertising, or continued positive communication fits its strategy.
- Track public disclosures: Independent expenditures in the district should be monitored through available public records so decisions rest on reported activity.
Coordination rules limit how a candidate can work with outside groups, and those rules vary by jurisdiction. Legal guidance should come before any joint plan or shared strategy. The budget question then becomes sharper: what minimum field budget reaches enough likely voters, and how should that budget change once outside groups enter the race?
Build Your Own Budget Before You File
A usable budget can be drafted in one sitting, then refined with local quotes and official rules. The sequence matters because electorate size drives contact volume, contact volume drives scalable costs, and the resulting total drives the donor target.
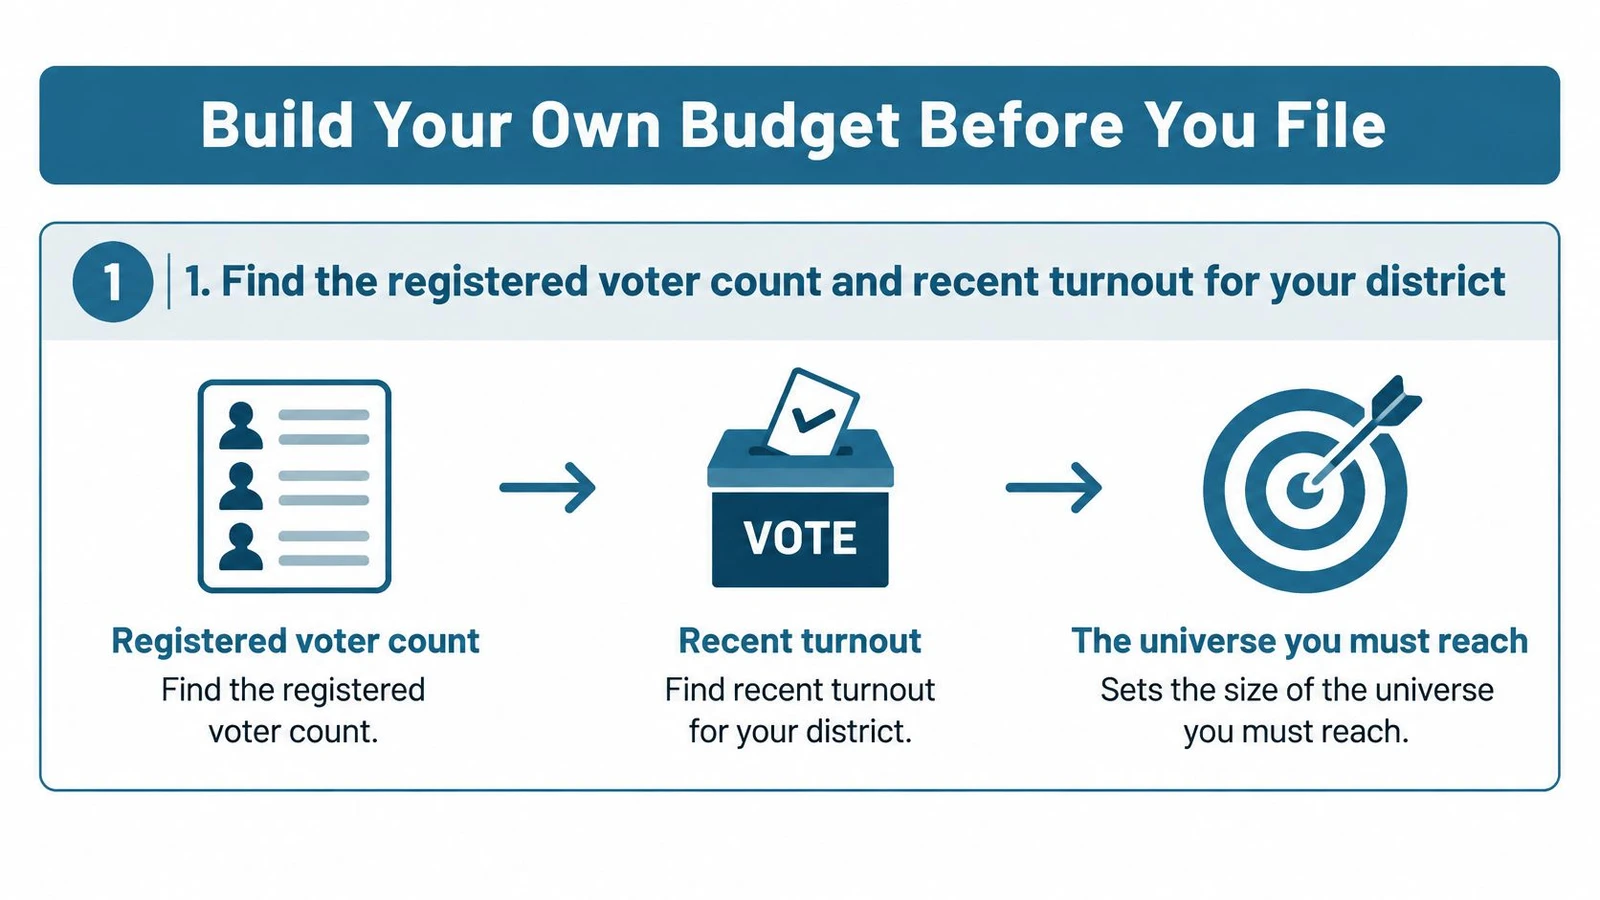
- Find registered voters and recent turnout: District turnout sets the likely voter universe the campaign must reach.
- Confirm local rules: Filing fees, disclosure schedules, contribution limits, and public financing eligibility should be verified with the relevant authority.
- List fixed costs: Filing, compliance, bookkeeping, and the required field software tier form the non-contact base.
- Price contact per voter: The campaign needs a mail piece cost, a digital cost for its chosen targeting, and the cost of one canvass shift per team member.
- Set the minimum field budget: Contact costs are multiplied by the number of likely voters who need repeated contact, not by every registered voter.
- Convert the total into a donor target: The donor math determines how many contributors are needed at realistic average gifts, with a cushion for returns and refunds.
- Add contingency for outside spending: Competitive districts need reserve capacity for late communications that the candidate doesn’t control.
- Review monthly against actual results: Spending should move toward channels reaching the most likely voters, based on completed contact rather than invoices alone.
Small visible items should also be priced rather than absorbed informally. For example, a field team ordering caps or other volunteer apparel can plan your branded headwear budget before placing an order, then record the expense in the proper campaign category.
The immediate action is concrete: confirm the filing deadline, open the campaign account, and reconcile the first month of spending against the plan. That first reconciliation reveals whether the budget describes the actual race or merely the race the candidate hoped to run.
Candidates who need to turn a voter universe into walkable routes, track canvass progress, and keep field data usable can explore what doornoc offers for local campaign operations. A visit can help a campaign price the field tools and voter data required before filing, so the budget supports actual voter contact rather than guesswork.
Looking for a tool to run this? doornoc’s canvassing software bundles voter data, automatic turf cutting, the mobile app, and live reporting in one platform.